Nanoplastics In Bottled Water: What the Study Really Found
You likely saw the January 2024 headlines about bottled water containing a “quarter million” plastic particles per liter. The story spread fast, and in most versions it landed as a simple takeaway: bottled water is full of plastic, therefore it is dangerous, therefore you should immediately change what you drink.

The underlying research was real, but much of the coverage flattened it into a single alarming number. In that compression, the most important parts of the paper were either minimized or lost entirely: what the researchers actually measured, what they explicitly did not measure, and why those boundaries matter if you are trying to make a sensible decision.
In this article, we will explore what the nanoplastics study actually says about bottled water, why the new particle count is largely a measurement story, what remains unknown about health effects, and how to respond proportionately without overreacting to an unsettled evidence base.
No. 1
What the Researchers Actually Measured
The paper was published in the Proceedings of the National Academy of Sciences in January 2024 by a team at Columbia University and Rutgers. It generated a widely repeated number because the researchers used a newer, more sensitive method than many previous studies.
The technique is called stimulated Raman scattering microscopy. In plain terms, it uses two lasers aimed at the same water sample and tuned so that specific molecules resonate and become visible. This matters because it allowed the team to detect far smaller particles than earlier methods typically could.
Why the Instrument Matters
A key detail is the lower detection limit. The researchers reported being able to visualize particles down to about 100 nanometers. That is far below what the human eye can see and smaller than the threshold used in many earlier microplastics studies.
To keep the scale intuitive:
A human hair is roughly 83 microns across
One micron equals 1,000 nanometers
Many of the particles in this study were far under one micron
The headline number is dramatic, but the driver is not necessarily a sudden change in bottled water. It is that the “microscope got better,” so to speak, and therefore it could count particles that older methods would miss.
What the Study Design Looked Like
The researchers were quite narrow and explicit about what they did:
Three popular bottled water brands sold in the United States
Five samples from each brand
The team declined to name the brands
They reported:
110,000 to 370,000 plastic fragments per liter
An average around 240,000 fragments per liter
Roughly 90 percent were nanoplastics (under one micron)
Roughly 10 percent were microplastics
Seven specific plastic types were identified, including PET and polyamide
The 2018 Comparison That Changed the Story
A widely cited 2018 study found an average of 325 particles per liter in bottled water. If you place that next to “240,000 per liter,” it looks like bottled water became radically more contaminated in a few short years.
But that interpretation misses the key point: the newer study was able to detect much smaller particles. The 10-to-100 times jump is best understood as a detection and measurement story, not as proof that the water supply suddenly worsened by orders of magnitude.
No. 2
What the Study Does Not Establish
Most headlines skipped this part, yet it is the most useful section for readers who want clarity rather than fear. The study counted particles. It did not establish what those particles do inside the human body, nor did it produce evidence that the measured particles cause harm at the levels detected.
Presence Is Not the Same as Effect
Counting particles establishes that particles exist in the samples. It does not answer whether they are toxic, what dose matters, or what long-term outcomes might be associated with exposure in real-world conditions.
The researchers themselves emphasized this distinction in interviews at the time. Nanoplastics are of intense scientific interest partly because their size raises the possibility that they could cross cell membranes and enter the bloodstream in ways that larger particles might not.
That is a reason to study them, not a conclusion about human health outcomes.
Limits of the Sample and Comparisons
A few constraints are straightforward but easy to overlook when a number goes viral:
Three brands is not “bottled water” as a category
Five samples per brand is a start, not a definitive market survey
The researchers explicitly said they wanted to test more brands and more samples
They declined to identify the brands, which prevents consumer-targeted conclusions
What Was Not Measured Alongside Bottled Water
The study measured bottled water. It did not compare those specific results to tap water in the same analysis.
That matters because municipal water can also contain particles. Without measuring both in parallel, you cannot use this paper to say, in a quantified way, that bottled water is cleaner or dirtier than tap water.
Concentration Is Not Dose
The study reports particles per liter, which is a concentration measurement.
Many media summaries effectively converted that into an implied daily dose, without addressing:
How much bottled water different people actually drink
Whether consumption is occasional or daily
What fraction of ingested particles are absorbed versus passed through
Whether certain groups have meaningfully different exposures
Concentration numbers are useful, but they are not automatically a health-risk statement.
The Most Underreported Limitation: Identification Was Partial
This is the detail that reframes much of the public interpretation.
The seven plastic types the researchers could positively identify accounted for only about 10 percent of the total particles they imaged. The remaining roughly 90 percent produced signals that did not match any reference standard the researchers had available.
In other words:
The team detected a very large number of particles
They could confidently identify the chemical type of about one in ten
That is still a legitimate, important scientific finding. It is also far more uncertain than the “settled danger” tone that some coverage suggested.
No. 3
Where the Plastic Appears to Be Coming From
One of the more actionable aspects of the paper was not about the source water itself. It was about packaging and processing, meaning the plastic may be introduced after the water is collected.
Packaging and Processing Pathways the Study Points To
The study found PET among the identified particles. PET is the plastic used in many single-use water bottles. The lead author noted that fragments likely enter the water as bits slough off the bottle, particularly when the bottle is squeezed or exposed to heat.
Polyamide also appeared among identified plastics, and a plausible origin is the reverse osmosis membrane used during filtration in bottling. That suggests the purification step itself may contribute particles.
From a practical perspective, this makes the finding more of a packaging and processing story than a simple “water quality at the source” story.
Why Heat and Handling Matter
If some particles originate from the container, then storage conditions change the exposure pathway.
Key implications:
A case of bottled water stored in a hot car is not equivalent to the same case stored in a cool pantry
Handling patterns can matter, including squeezing bottles and repeated physical stress
The container is a variable the consumer can sometimes control more easily than the upstream water source
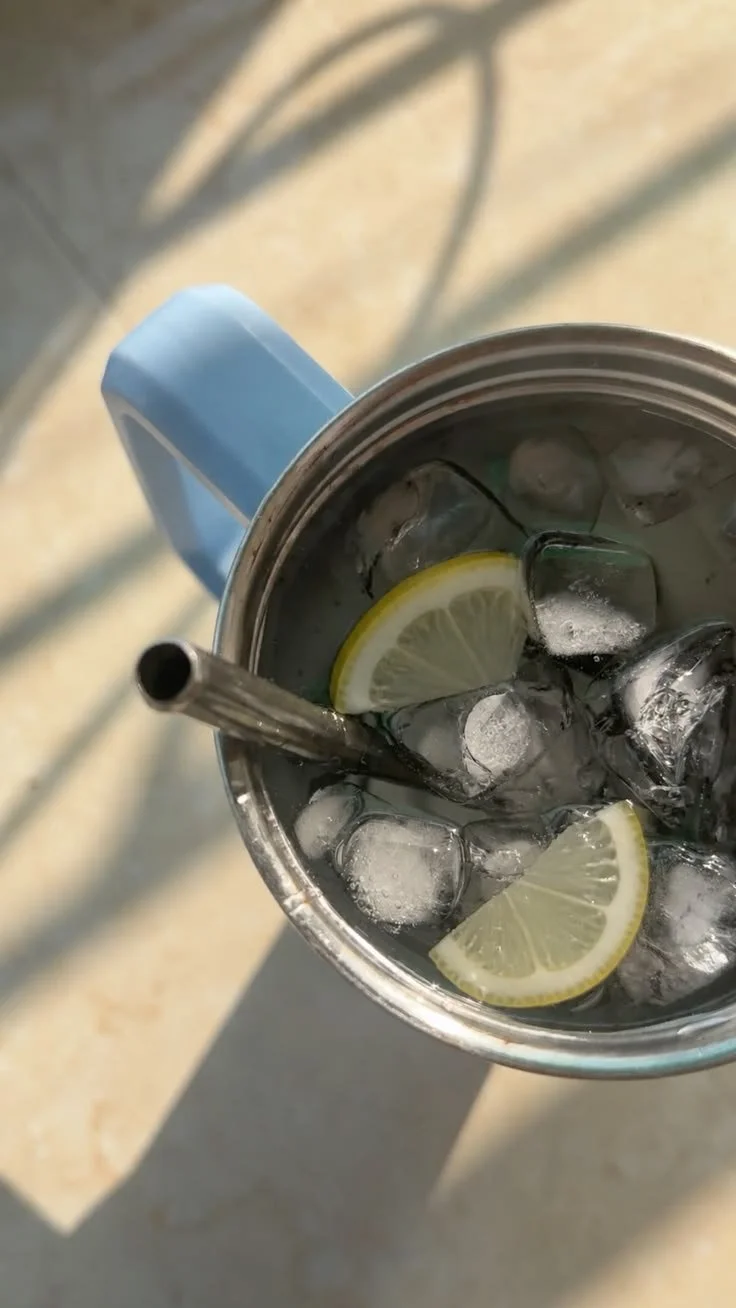
The cautious claim is not “you can eliminate plastics entirely.” It is “you can reduce one identified pathway by changing what your drinking water touches.” A stainless steel cup such as a Polar Camel puts no polymer in contact with what you are drinking, which removes that pathway entirely.
No. 4
How the Coverage Changed the Meaning of the Study
The most valuable lesson here may be less about bottled water and more about how scientific findings are reshaped on their way to your feed.
The Information Chain Effect
The transformation typically follows a predictable pattern:
A careful paper with caveats is published
A press office produces a summary that often includes key limitations
Wire services condense it, retaining some nuance
Aggregators condense it again, keeping less nuance
Lifestyle publishing turns it into a clear threat with an implied fix
At no point does anyone need to lie for the final message to become distorted. The distortion can happen through simple omission: the least exciting sentence gets cut first.
Why Caveats Disappear
Caveats rarely survive editing because they are less clickable and harder to summarize. A sentence like “we could only identify about 10 percent of the particles” is scientifically central but narratively inconvenient.
The wellness and consumer-products ecosystem is especially vulnerable to this because fear converts better than nuance, and because it is easy to attach a product recommendation to a scary headline.
The Real Personal Cost: Calibration
The cost to most readers is not a single bad purchase. It is a long-term loss of calibration.
If you cannot easily distinguish:
a new detection method producing a larger count
from a genuine spike in contamination
then you end up reacting to whichever study is framed most dramatically rather than to the studies that most meaningfully change what is known.
There is also a credibility cost. When provisional findings are repeatedly presented as settled, people eventually stop paying attention, including when something well-established comes along.
No. 5
A Proportionate Response
Given what the study does and does not show, a sensible response focuses on low-regret steps that align with the most defensible interpretation of the evidence.
Low-Regret Actions Supported by the Mechanisms Discussed
Remove the identified source where it is easy
If you can reduce contact with single-use plastic in your daily routine, you reduce one documented pathway without needing the study to prove harm.Avoid storing plastic bottles in heat
This follows directly from the proposed mechanism of bottle-sourced fragments and is practical for many people.Apply the same skepticism in both directions
“No detectable plastic” marketing claims deserve as much scrutiny as alarming ones, especially when the testing method and detection limits are unclear.Notice when you already had good reasons
Cost, waste, and convenience are strong reasons to reduce reliance on bottled water even without any nanoplastics study.Leave room to be wrong in either direction
Research could ultimately show lower risk than feared or higher risk than expected. A response you would not regret under either outcome is the safest posture now.
No. 6
The Better Question to Carry Forward
The most useful outcome of reading about this study is not a single yes-or-no decision about what to drink from. Most people already had enough information to justify reusable containers and sensible storage habits before January 2024.
The more durable skill is noticing how the finding reached you, and how much of its final “shape” was determined by everything that happened after publication.
Another study will cross your feed soon with a large number in the headline and a recommendation at the bottom. The question worth asking is not simply whether the finding is frightening, but what the researchers said they could not yet conclude, and whether the article told you.
Takeaways
The January 2024 study produced a high particle count largely because it used a newer technique that can detect much smaller particles than many earlier methods. The headline number is real, but it should be interpreted in the context of improved detection rather than assumed as evidence of a sudden contamination surge.
The paper does not establish that nanoplastics in bottled water harm humans, nor does it compare bottled water directly to tap water in a way that allows simple rankings. A major limitation is that only about 10 percent of the imaged particles could be chemically identified with available reference standards.
A proportionate response is to reduce easy, identified pathways such as prolonged heat exposure of plastic bottles and routine contact with single-use plastic when alternatives are convenient. Just as importantly, use the episode as a reminder to look for caveats, sample size, and measurement limits before treating any viral number as a settled conclusion.
Looking for resources?
At Hello Lovely Living, we aim to empower you to earn and save money and time while benefiting from our expansive network of home, life, wellness, travel, work-from-home, career, and business resources and opportunities. Discover a wealth of tools to support your journey.